

In March 2020, Eugene Tartakovsky of 3Jane Technologies and three co-authors posted a short paper to arXiv. It asked a simple question: do past returns in the largest crypto markets tell you anything about the next ones? The answer depended on the time frame. On 5-minute and hourly bars, every market showed significant autocorrelation. On daily and weekly bars, the tests disagreed.
The paper sits in our research library alongside the code and data that reproduce it.
Publication record
The paper was the first in a planned series on the efficiency of major cryptocurrency markets.
Authors
The arXiv record lists four authors in this order:
- Eugene Tartakovsky, 3Jane Technologies
- Ksenia Plesovskikh, Research Center for Digital Assets and Blockchain
- Anastasiia Sarmakeeva, Institute of Mechanics, Ural Branch of the Russian Academy of Sciences
- Alexander Bibik, Research Center for Digital Assets and Blockchain
If you open the PDF, you'll see Anastasiia Sarmakeeva printed second and Ksenia Plesovskikh third. We follow the arXiv order for citation, since that's the publisher record. Eugene submitted the paper to arXiv, and Eugene's research also appears under a public ORCID record.
Versions and dates
The paper has several dated records, and only the first one sets its publication date:
- Version 1: submitted to arXiv on March 30, 2020, at 14:42 UTC.
- Version 2: revised on March 31, 2020, at 11:55 UTC, with the note "Update: Typos fixed."
- The PDF itself carries the date April 1, 2020.
- SSRN: posted July 25, 2020, and revised August 11, 2020.
March 30, 2020 is the original publication date; the later dates belong to the revision, the PDF and the separate SSRN record. The paper is arXiv:2003.13517, filed under Quantitative Finance > Statistical Finance (q-fin.ST), and runs 11 pages with 12 figures.
Why the question mattered
Market efficiency is one of the most studied, and most argued over, ideas in finance. In 2020, crypto markets were young enough that the question was still wide open for them.
A young market with different trade-offs
The paper treats crypto as a new, fast-growing market that borrows features from older ones. Compared with traditional markets, it offered trading around the clock every day of the year, with fast and often immediate execution and settlement. Its weaknesses came from immaturity:
- too few established tools
- not enough services and businesses to create competition and improve reliability
- weak connections to traditional markets, with no prime brokers and, until recently, no custodians serving crypto
The assets themselves were new too. Coins issued on public blockchains aren't controlled by any government or institution. Every transaction is immutable and visible to everyone for as long as the underlying chain exists.
The efficient market hypothesis as a detector
The Efficient Market Hypothesis, or EMH, says prices reflect all available information, so profiting from predicting price moves should be very hard. It has been central to finance since the early 1970s, and attempts to prove or refute it have produced inconsistent results.
So why use it? The paper treats the EMH as a test suite for spotting markets that are definitely not efficient, not as a description of how markets really work. Knowing where inefficiency lives tells you where further research might pay off. Earlier studies had applied this lens to the Dow Jones Industrial Average and the EUR/USD currency market.
The tests here concern the weak form of efficiency, where the information set is just the history of prices. The paper also draws on the Adaptive Market Hypothesis. That view treats perfect efficiency as an unreachable but useful benchmark, and lets a market's relative efficiency change over time.
What earlier studies found
Prior work on crypto was split: some studies found Bitcoin close to efficient, while others didn't support the EMH. Three studies shaped this paper most directly:
- Andrew Urquhart, in 2016, used Ljung-Box, runs, dispersion-ratio and BDS tests and found Bitcoin wasn't weak-form efficient, though some tests hinted it was becoming more efficient.
- Kristoufek and Vosvrda, in 2019, ranked six cryptocurrencies with an efficiency index and found all of them inefficient over the full period, with results depending on the quote currency.
- Akihiko Noda, in 2019, found that efficiency varied over time, that Bitcoin was usually the most efficient market, and that the market had improved.
Three years after Urquhart's study, the Bitcoin market had changed a lot, and the authors wanted an updated picture. They also noted how little research treated crypto as a full-fledged market, despite its prominent place in global finance.
The hypothesis being tested
The null hypothesis was that all four markets in the study were efficient. To count as efficient, a market had to meet three conditions on every time frame:
- No statistically significant autocorrelation of any order.
- A Ljung-Box p-value that never drops below 0.05 on any lag.
- Rolling autocorrelation that stays stable and close to zero.
Failing any one of them contradicts efficiency. The paper notes that the third condition follows from the first. Checking it separately still matters, because it shows whether a dependence persists over time or only appears in part of the sample.
Data
The study covers four markets, chosen for their liquidity and for how differently they behave:
- BTC/USD on Bitfinex, one of the oldest and most liquid spot crypto markets: July 1, 2014 to July 1, 2019.
- ETH/USD on Bitfinex, the second-largest cryptocurrency against the dollar: March 9, 2016 to July 1, 2019.
- ETH/BTC on Bitfinex, a cross pair that behaves significantly differently from dollar pairs: March 9, 2016 to July 1, 2019.
- XBT/USD perpetual swap on Bitmex, then the world's most liquid crypto market at 2.20 billion USD traded daily by Bitmex's reports: October 12, 2017 to July 1, 2019.
The paper describes its window as the last five years, but only BTC/USD spans the full five years. The Ether series start in March 2016 and the Bitmex swap in October 2017, so comparisons across markets cover different stretches of history.
Every test ran on four bar sizes, labeled 5m, 1H, 1D and 1W. All calculations used Python with the pandas and statsmodels libraries, and the datasets are published with the paper's code.
Methods
The three methods build on each other: one checks individual lags, one checks lags as a group, and one checks whether a dependence holds up over time.
Pearson autocorrelation
Autocorrelation measures how strongly a return series correlates with its own past values. For a process X with mean µₜ and variance σₜ² at each time t, the coefficient between times t₁ and t₂ is R(t₁, t₂) = E[(Xₜ₁ − µₜ₁)(Xₜ₂ − µₜ₂)] / (σₜ₁ σₜ₂), where E is the expected value.
No autocorrelation is a necessary but not sufficient condition for efficiency. Finding it is enough to reject the EMH, but not finding it doesn't prove a market is efficient.
Ljung-Box test
The Ljung-Box test asks whether a whole group of lags, taken together, looks like independent noise. Its null hypothesis is that the data are independently distributed, so any correlation in the sample comes from sampling randomness. The alternative is serial correlation.
For a series of length n tested over h lags, the statistic is Q(h) = n(n + 2) Σ ρ̂ₖ² / (n − k), summed over k = 1 to h, where ρ̂ₖ is the sample autocorrelation at lag k.
Under the null, Q asymptotically follows a chi-squared distribution with h degrees of freedom, and randomness is rejected when Q exceeds that distribution's (1 − α) quantile. The study computed p-values for up to 30 lags with a 0.05 threshold.
Rolling-window autocorrelation
A dependence that shows up in the full sample might come from one unusual stretch. To check, the authors computed first-order Pearson autocorrelation in a rolling one-year window. A stable deviation from zero would also contradict efficiency, and the shape of the curve shows how the dependence changed over time.
Results
Here's where the time frames split. Short horizons gave a clear answer, and long horizons didn't.
5-minute and hourly bars
Pearson autocorrelation found significant low-order dependence on every market. BTC/USD and XBT/USD showed negative low-order autocorrelation, while the Ether pairs showed positive first-order and negative second-order autocorrelation.
All four markets shared one specific pattern: significant positive autocorrelation at the 16th lag on hourly bars. The Ljung-Box test agreed, with p-values at zero for every market on all lags, starting from the first.
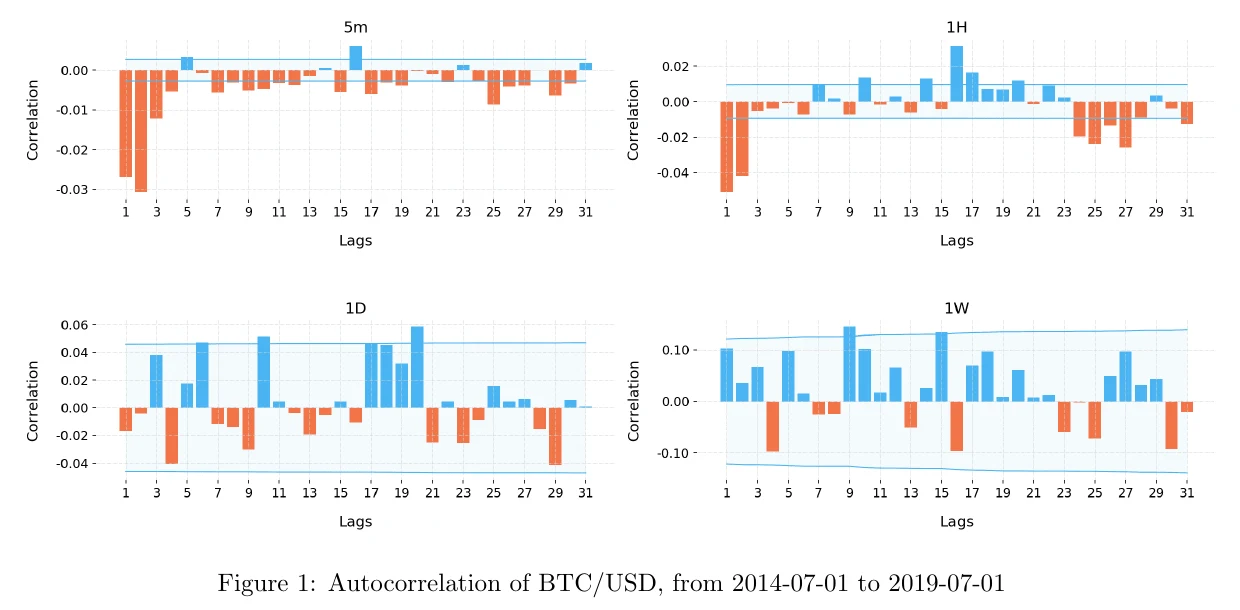
Figure 1, PDF page 4: Pearson autocorrelation of BTC/USD returns on 5-minute, 1-hour, 1-day and 1-week bars, July 1, 2014 to July 1, 2019.
Daily and weekly bars
Pearson autocorrelation found nothing significant on daily or weekly bars, on any market. The Ljung-Box test disagreed in places, and the disagreement was market-specific:
- XBT/USD: the p-value never dropped below the threshold on any lag.
- BTC/USD: p-values sat above the threshold on low lags, dropped below it for several lags, then rose again.
- ETH/USD, weekly: most lags, starting with the first, fell below the threshold.
- ETH/BTC, daily: every lag but one fell below the threshold.
The authors called the BTC/USD result statistically significant but probably too unstable to be usable. A significant p-value and a usable pattern aren't the same thing, and this is a clean example of the gap.
Autocorrelation over time
The rolling window showed which effects held up across the sample:
- Hourly: stayed negative over time on every market.
- Weekly: stayed positive most of the time on all markets.
- 5-minute: differed by asset, with Ether pairs tending positive and Bitcoin pairs tending negative.
- Daily: behaved differently on every market.
The BTC/USD chart adds nuance to that 5-minute summary. Its 5-minute coefficient changes sign over the period, while the hourly line stays negative and the weekly line is mostly positive.
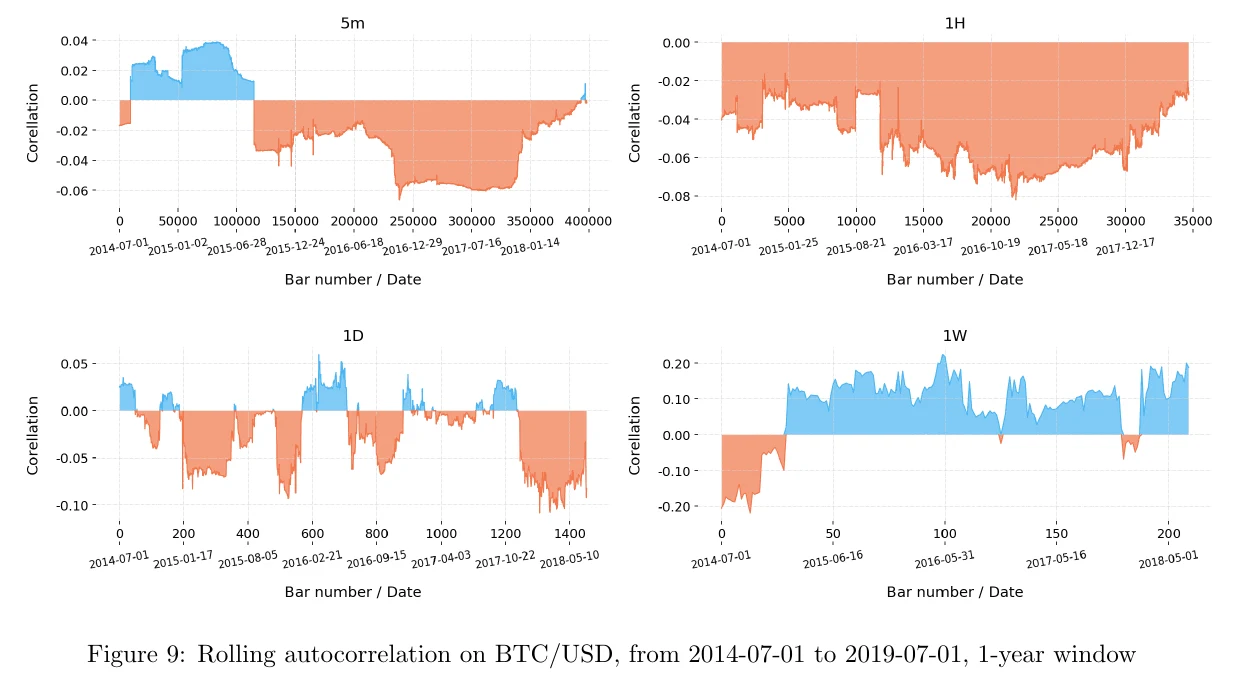
Figure 9, PDF page 8: first-order autocorrelation of BTC/USD returns in a rolling one-year window on 5-minute, 1-hour, 1-day and 1-week bars, July 1, 2014 to July 1, 2019.
What the findings support
On 5-minute and hourly bars, all three efficiency conditions fail for every market. Pearson autocorrelation found the dependence, Ljung-Box confirmed it, and the rolling window showed it persisting rather than appearing as a one-off artifact.
On daily and weekly bars, the results weren't stable or uniform enough to reject the EMH or to draw practical conclusions. The one notable tendency was strongly positive rolling autocorrelation on weekly bars across all markets.
Finding a market statistically inefficient isn't the same as finding a way to trade it. The paper says these findings alone aren't enough to extract profits, and it reports statistics, not trading results. Its practical suggestion is narrower: rolling autocorrelation might work as a feature that improves the predictive power of machine learning models.
Testing whether a feature like that actually helps a model calls for validation that respects the time order of financial data. Our article on financial cross-validation covers that side of the work.
The planned series
The paper opened a series of short articles that would use different statistical tests and distribution properties to see whether crypto markets are efficient and how that changes over time. The next steps it named were:
- testing for long memory in the same markets
- measuring the statistical characteristics of return distributions
- using the series as a baseline for ways of working with financial data that make markets look less efficient and more predictable
The 3Jane articles repository lists the long-memory and return-distribution articles as upcoming, with work on volume bars planned. That fits the name of this paper's code folder, which marks it as a study of time bars.
Reproducibility
The paper describes its results as fully reproducible. The datasets, source code and a runnable Jupyter notebook are public, so you can rerun the analysis yourself. These are the records to start from:
- The arXiv record, which offers the PDF, an experimental HTML version and the TeX source.
- The Paper PDF itself, as a direct download.
- The arXiv-issued DOI, 10.48550/arXiv.2003.13517.
- The SSRN record, abstract 3639430.
- The code, data and notebook on GitHub.
For the rest of our published work, head back to the research library.