Building a quantitative research pipeline: data, features and event labels
The fixed, reproducible stages that take raw market observations to event labels, and where each stage's output goes next.

Market data rarely behaves like the independent samples most statistical tools assume. Returns depend on recent returns, labels overlap in time, and a backtest without costs flatters almost any model. Our research is built around those problems.
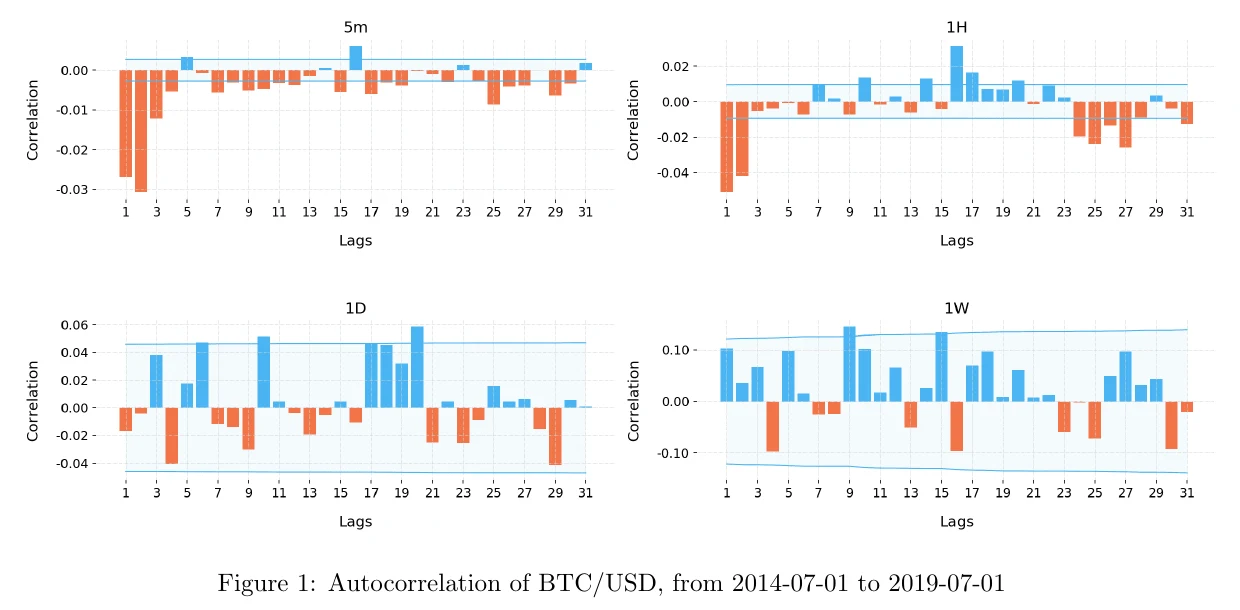
Do past returns in major crypto markets predict the next ones? We tested BTC/USD, ETH/USD and ETH/BTC on Bitfinex and XBT/USD on BitMEX. Significant autocorrelation showed up on 5-minute and hourly bars in every market.
numpy_ext adds missing-value handling, rolling and expanding windows and parameter-range helpers to NumPy. It runs the paper's rolling one-year autocorrelation.
tindicators is our fork of Tulip Indicators, with over 160 technical indicators and C, Python and C# interfaces.
The fixed, reproducible stages that take raw market observations to event labels, and where each stage's output goes next.
How purging and embargo stop labels from leaking across the train/test boundary, worked through with real indices from our test suite.
From the IID bootstrap to block methods for serially dependent data. Each method gets a plain explanation and a picture of one iteration.
Probability checks, costed simulation, and Kelly and Monte Carlo limits on exposure. One scenario runs from probability to net PnL.